A Climate of Change
Scientific organizations around the world, and no less than arch-physicist Stephen Hawking, have declared climate change the single greatest threat facing humanity today, urging that the risks of ignoring this prognosis only swell with time. But somewhere between round table talks at academic conferences and the public conversation, this message has been skewed, and in many ways disfigured beyond recognition. Polling has shown that what the public thinks about climate change is not what scientists think about climate change.
Much of the general public’s doubt surrounding the veracity of climate science stems from political partisanism in particular and the interpersonal costs of accepting scientific truths that are out of step with one’s social group more generally. In recent decades, we’ve seen a growing rift in America between those who identify with the ‘culture’ of science — for whom the emphasis on evidence and facts and the championing of skepticism and reason-based dialogue are organizing principles — and those who uphold ideology and cultural values, in lieu of scientific evidence, as the deciding factor in determining which ideas and conclusions they will accept. In many such cases, ideological commitments are strong enough to override plain facts.
This cultural and intellectual gap is only exacerbated by the polarizing effects of today’s mainstream media, which traffics in simplified sound bites disobliged to facilitate competent understanding of the topic. The most prominent voices heard on the airwaves and network news are too often chaperoned by a desire to disinform and distort rather than educate and clarify. And this leaves large swathes of the population under-equipped and lacking the necessary information to form tenable positions on matters of policy. All of this should call attention to just how much more work there is to do in communicating the science.
Here I address several of the more popular objections to global warming.* While it’s unrealistic to cover the full gamut of opposition, my aim is to engage the most substantive of the bunch. You won’t find any political or policy talk in this piece. There isn’t one set of physics for Republicans and another for Democrats, after all. Nor will I delve into the various motives one or the other side may have in furthering their respective position, or proposed metacognitive explanations for why people believe as they do. I will intentionally eschew these ideological herrings and instead rely solely on the climatological evidence, the balance of which can and should help shape discussion in other areas.
*The terms ‘global warming’ and ‘climate change’ are often used interchangeably. Some experts prefer one or the other, but the latter is perhaps best understood as a symptom of the former. The reverberatory effects of a mutating climate — sea level rise and coastal erosion, weather volatility and intensity, threatened biodiversity, fresh water availability, national security, food security and global human health — are each symptomatic of a monotonic increase in global temperatures.
The Consensus
It will first be underscored that anthropogenic global warming reflects the longstanding consensus of research on climate [1] [2] [3] [4] [5] [6] [7] [8] [9] [10]. Every national scientific academy the world over finds the evidence conclusive for human-caused climate change.
A consensus this strong can only reflect the strength of the evidence on which it is based. As Feynman said, “It doesn’t matter how beautiful your theory is, it doesn’t matter how smart you are. If it doesn’t agree with experiment, it’s wrong.” The assurances of science come not from authority or human whim but from independent verification by experts attempting to confirm, disconfirm or expand upon the work of other experts. Bad eggs and bad science are gradually rooted out through peer review, basic competition, and better science. Along the way, we settle on theories which successfully interact with testable predictions. That we are behind the recent temperature rise on earth has stood the test of time because no other theory has withstood empirical scrutiny.
The level of agreement around the central questions in climate science — rarely reached outside of major integrating ideas like the germ theory of disease, cell theory and common descent — rests on converging lines of inquiry from thousands of studies and observations around the world conducted using a wide variety of methods, instrumentation and analysis. The research to date points us to the unambiguous conclusion that our planet is warming at an unprecedented pace consistent with increases in fossil fuel production and mass deforestation.
Any objections to the contrary will acquire credibility to the extent they acquire empirical support. If a better explanation is one day put forward that can account for all of the available data while ruling out the anthropogenic fingerprint, our physical understanding of the earth’s climate system will be updated accordingly. Meanwhile, the scientists responsible would surely make the short list for the next Nobel. As we’ll see, however, it is precisely our solid physical understanding of climate that renders this prospect quite unlikely.
Global Warming at 10,000 Feet
 A clear picture of global warming is best achieved with a firm grasp of two concepts: greenhouse physics and the carbon cycle. In fact, our present situation can be entirely explained by physics. The age-old question before us is how can a colorless, odorless trace gas like carbon dioxide (CO2) create such disruptive shifts in the earth’s ecosystems?
Carbon dioxide has been a known variable in atmospheric science for well over a century thanks to research by the 19th century physicist John Tyndall. The earth receives its energy from the sun. As sunlight (shortwave radiation) penetrates our atmosphere, a portion is reflected back into space, while the rest makes it down to the surface. The surface then re-radiates this heat in the form of infrared (longwave) radiation. Tyndall noticed that carbon dioxide absorbs the longwave variety, blocking its escape to space. With CO2 blanketing the air, some of the outgoing heat is trapped and redirected back toward the surface. Consequently, Tyndall was the first to demonstrate the greenhouse effect — ostensibly named for the gases that contribute to it — in the 1860s.1
Some 30 years later, a Swedish scientist by the name of Svante Arrhenius began taking seriously the important properties of CO2. Building upon the work of Tyndall, Fournier and several others, he investigated the CO2 impact on climate and eventually came up with some of the earliest calculations on climate sensitivity, construed as the climate’s response to a doubling or halving of atmospheric CO2. With great prescience, he predicted that combustion processes, like the burning of fossil fuels, can release enough carbon to alter global temperature, all due to the greenhouse effect.2
Just as Arrhenius’ models indicated, when driven to extremes the greenhouse effect can interfere with the earth’s carbon cycle. Under natural conditions, a steady amount of carbon flows through the various reservoirs of this cycle, with a balanced exchange taking place between the oceans, atmosphere, biosphere, and soil. Prior to the Industrial Revolution (1750), these fluxes were largely in equilibrium. But since CO2 and other greenhouses gases absorb upgoing radiation in the earth’s atmosphere, human activities have resulted in the earth retaining more heat than it is releasing to space. Higher and higher CO2 concentrations tip the carbon cycle into trapping more and more heat within our troposphere, introducing a cumulative energy imbalance that gradually warms the earth’s atmosphere, surface, and oceans.
Let’s look at some common objections to this theory.
Objection I
A common question is how do we know the earth’s current warming trend is not simply part of a natural cycle? The one thing we can say with certainty about climate is that it is not static. The earth’s climate is in a constant state of flux and has been as far back as we can observe. The ebbs and flows of the past are well understood today. Major natural drivers include the Milankovitch cycles, which tightly describe the change in climate relative to the earth’s orbital patterns3; fluctuations in solar magnetic activity, which historically have correlated closely with global climate trends; and volcanism, which has periodically pumped astronomic amounts of CO2 and other gases into the atmosphere.
One of the most significant findings of paleoclimatology, moreover, has been to establish, once accounting for ice age signals, that temperature lags behind CO2. That is, as atmospheric CO2 rises and falls, climate follows suit, just as the work of 19th century physicists intimated. That ancient climates would exhibit this causative relationship was predicted in a 1990 paper by James Hansen and other scientists before ice core data was robust enough to support it. Since that time, the role of CO2 in planetary temperature trends has been corroborated again and again, including by our oldest ice cores sampled from the East Antarctic.
In sum, we know the effect CO2 exerts on climate, we know what drove climate in the past, we know how much carbon we’ve put into the atmosphere through energy production, industrial processes, transport and land-use changes (discussed further below), and we know the time scales associated with changes of the past and changes of the present. Taken together, we can conclude that humans are the cause of recent climate change and that the speed of the change is irregular.
We know recent trends are human-caused because we’ve identified and measured the distinct fingerprints that only human activities can leave behind. We know these trends are anomalous because the rate of change is far greater than the background rate of all known natural forcings. The incline in average surface-atmospheric temperature is much steeper in recent decades compared with the more gradual increases of historic interglacial periods and cannot be accounted for by the causal mechanisms of the past. The level of solar intensity no longer tracks with global climate.4 Oceanic warming no longer makes sense if we only include natural factors in our climate models. Volcanic, orbital, and other natural forcings simply cannot account for the sharp upshifts we are seeing. Carbon dioxide from human actions can.
To get a sense of the degree of change experienced over the last two centuries, Berkeley Earth — a project founded by former skeptic Richard A. Muller and funded in part by the Koch Foundation — charted temperature readings reaching back to 1750 and compared them with three other global datasets.5 As seen below, Berkeley Earth, NOAA, NASA, and the UK’s Met Office have all produced highly correlative data.
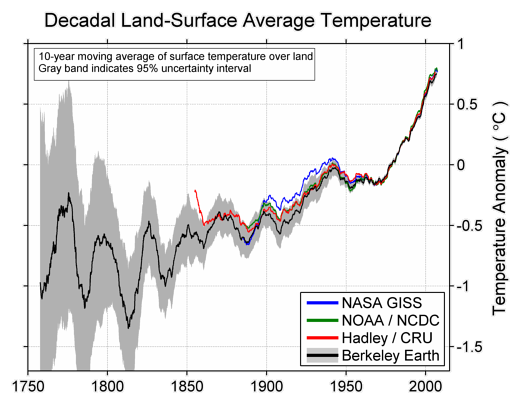
Berkeley Earth Temperature Record: 1750-Present
Since 1880, the average global surface temperature has risen 1.1° Celsius (2.0° F). One degree of warming may not sound like much, but consider that the total variation between the peak of the last ice age and the present interglacial was 4-6° C. Historically it’s taken around 5,000 years to undergo a change of that magnitude. In contrast, our instrumental records report a gain of over 1 degree in a single century, with two-thirds of that increase occurring since 1975. This equates to roughly ten times the background rate of ice-age-recovery warming.
Moving closer to present, not only were the past three decades the warmest on record, but 16 of the 17 hottest years have occurred since 2001. The trend is clear and shows no signs of slowing down. We are currently living in the hottest age in human history. Historical warming patterns can be linked to natural causes that cannot adequately account for the rapid changes happening now.
Objection II
While it is true that the earth has seen strong CO2 levels in the past, we were not around to witness them. We can trace the basic outlines of these events, such as when CO2 rise is preceded by supervolcano eruptions or by deglaciation events activated by orbital cycles. More importantly, we can trace the temperature rise trailing the rise in CO2 — the true danger of GHG loading. During the Paleocene-Eocene Thermal Maximum 56 million years ago, for example, CO2 billowed to unusually high levels. In response, global temperature rose by 5-8 degrees centigrade, visiting heat death and forced migration upon much of the planet.
The latest measurements from NOAA show a global CO2 concentration of 410 parts per million (ppm). Examining air bubbles long frozen in ice caps, like those recovered from the Antarctic, indicates that this present level is higher than at any time during the last 800 thousand years and possibly the highest since the Pliocene some three million years ago. In other words, the last time the CO2 density was this high humans, and thus human civilization, did not exist.
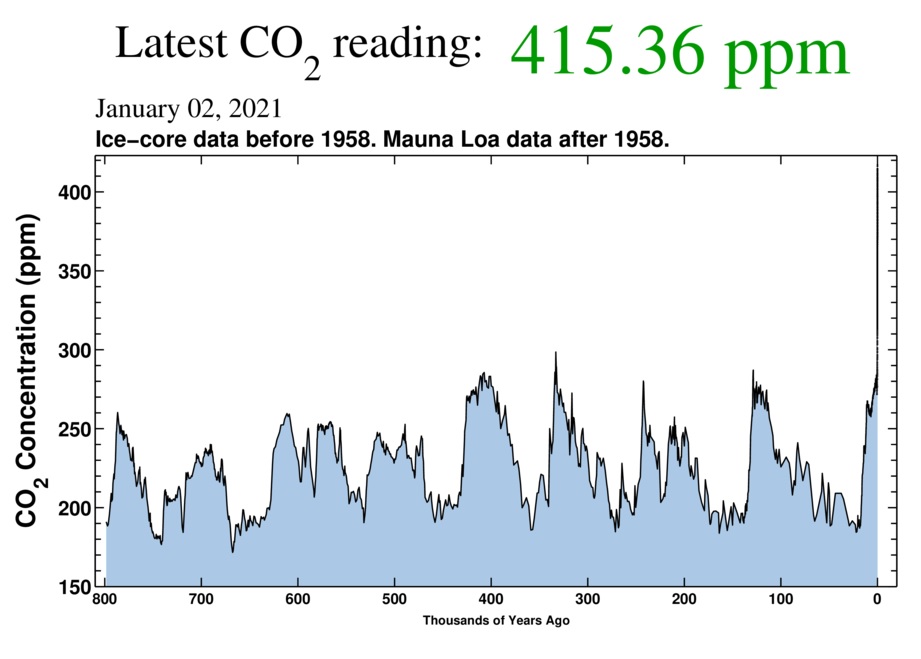
The Keeling Curve: 800,000 years to Present
But is this upswing in CO2 and corresponding temperature rise consistent with increases in fossil fuel production? Consider that pre-industrial levels hovered around 280 ppm — more than 40% lower than today’s levels — and that historically the rate of change rarely approached 1 ppm per century. Since 1958, when NOAA’s Mauna Loa record began, concentrations have risen by more than 90 ppm, with about half of that total occurring over the last three decades. Zeroing in on the triggerman: “When we add the observed CO2 increase in the atmosphere to the observed increase in the oceans, the sum is approximately equal to all of the coal, oil, and natural gas burned since the 19th century.”
Here again, the preponderance of evidence tells us the global CO2 increase is an anomaly best explained by human-produced greenhouse gases. We’ll further quantify human contributions in the next section.
Objection III
 One of the oldest reprisals against global warming is the claim that natural carbon emissions exceed human emissions and therefore we cannot possibly be to blame. This is a misleading way to look at the situation. Rather, the global carbon cycle should be understood in terms of a balanced budget in which transactions on one side of the ledger offset the other, and instead of revenues and expenditures we have carbon sinks and carbon sources. If the budget moves further away from equilibrium each year, what’s important is not who made the biggest transactions but who is responsible for the imbalance. In short, it’s the perturbation, and not the total contribution, that matters.
As you can see from the graphic below, the oceans, soil and plants are far greater annual contributors to atmospheric CO2 than human-associated emissions. But their function as both carbon source and sink ensures their fluxes cancel over time. Human actions are now putting more than 9 billion tons of carbon into the atmosphere each year, with no anthropogenic sinks to make up the difference.
This surplus in the carbon budget has kicked the natural sinks into overdrive. The National Academy of Sciences has estimated that about 55% of total anthropogenic CO2 is pulled out of the atmosphere each year by land and ocean sinks, and there is evidence that the biosphere as a whole switched to a net sink after 1940. This explains why the rate of atmospheric CO2 is increasing about half as fast as the rate of human carbon production.

The carbon cycle. Numbers accurate as of 2010. Click to enlarge.
As to the claim that volcanic emissions outstrip human emissions, that is utterly false. While heightened volcanic activity has played a role in elevated CO2 concentrations at different points in the planet’s history, there has been only minimal contribution across the last two centuries. Presently, volcanic blowout gives off between 180 and 440 million tonnes of carbon dioxide annually, or less than a paltry 1% of the amount released by human activities.6
While the burning of coal and petroleum is the leading source of manmade CO2, a less discussed and far from negligible second source is deforestation. Photosynthesizers like plants and algae are key parts of the global ecosystem, taking in CO2 from the atmosphere and giving off oxygen. When plants die, their CO2 stores are released into the air. That means every time we cut down a tree we are introducing more carbon gas for our climate to contend with, and less vegetation to absorb it. Thus even though dying vegetation is natural, mass deforestation is not and should be addressed when a balanced planet is of utmost concern.
According to a 2015 study, we lose 15.3 billion trees every year to human-caused deforestation from land-use change, wildfires, and pest outbreaks, including 45 million acres of forests in 2014 alone (for reference, that’s roughly twice the size of Portugal). Around 5 billion of that total return or are re-planted, making a net loss of 10 billion trees annually. As the world’s trees soak up a sizable portion of tropospheric carbon, such widespread destruction translates into more heat-trapping molecules resident in our lower atmosphere. Tropical deforestation alone releases more than 1 billion tonnes of CO2 each year, while total annual deforestation from logging and land-use changes adds as much as 20% or as little as 10% more CO2 to the atmosphere on top of that emitted from fossil fuels.
From the above we can see that both major sources of anthropogenic CO2, even taken individually, rank an order of magnitude above volcanoes. Let’s lastly take a look at the oceans, which cover 71% of the earth’s surface and represent a huge repository both of the planet’s heat and CO2 stores.
As depicted in the above image, the oceans function as both carbon sink and source in proximate balance with the atmosphere over time. Its net function at the global scale is largely set by orbital cycles and thermal circulation patterns over long and short time scales, respectively. Due to our influence, the oceans currently operate as a net carbon sink, taking up between a quarter and one-third of the CO2 we generate. As we put more into the air, the oceans absorb more, to the tune of 2 GtC every year.7
How the oceans will respond over the long term is still unclear, but we are already seeing the short-term effects in the form of ocean acidification. All of the CO2 absorbed since pre-industrial times has reduced the ocean’s pH by 30%, creating grave concerns for marine life across the board. In the end, we are left with a lose-lose situation; whatever benefit there might be from relying on the oceans as a carbon depot in order to delay warming aloft is more than offset by its impact on the ecosystems below. And there is evidence to suggest its status as a net sink might be nearing the breaking point.8
When looking at net impact on climate, each of these natural emitters shallows in comparison to the anthropogenic scorecard. Between the years 1751 and 1900, we released 45 billion tonnes of carbon dioxide by burning fossil fuels, while the period between 1901 and 2000 saw a grand total of 993 billion tonnes released, or a 2,100% increase. And our unyielding reliance on dirty energy continues to widen the gap. In the last 25 years, we’ve upped annual fossil emissions from 22 to 36 billion tonnes.9
It is beyond clear that the smoking gun lies with us, not with volcanoes, plants, the oceans or other non-sentient formations. Our excess has forced a “regime change” upon the carbon cycle, one that humans have never lived under, and one that will require global cooperation to confront.
Objection IV
It’s of course true that CO2 is essential to life as we know it, but it does not follow that more is better. Alcohol is not hurriedly toxic but consume twelve beers in as many minutes and you’ll have newfound appreciation for the phrase ‘drink in moderation’. Steroids, as well, are naturally produced by the body, but adding prodigious amounts on top of that baseline can disrupt human physiology in myriad ways. Likewise, additional CO2 can stimulate plant growth, but dump too much carbon into the air and you alter the climate to the point that those plants can no longer survive. Plant varieties, as with most organisms, are sensitive to temperature swings outside the range for which they have adapted. Outside of that healthy range, the plant is unable to grow properly.
While the relationship between CO2 and botanical growth is complex, it’s long been established that the “greening” effect from rising CO2 levels is only proportional up to a point. There is a warming threshold (varies by crop) beyond which agricultural yields no longer increase, but begin to decline sharply due to changes in precipitation, water availability, soil moisture and plant nutrient levels — all effects exacerbated by climate change. Though trees and other vegetation do rely on CO2 for growth, you eventually run up against natural limits both to how much they can absorb and utilize and how much warming they can tolerate.
The ‘CO2 is plant food’ refrain only hangs together if you deny the link between CO2 and warming, which in turn is only possible if you deny the greenhouse effect. The consensus among agriculturalists and plant and climate scientists today is that any short-term gains from higher CO2 availability will be outweighed by the harmful effects of additional warming. Per the IPCC’s latest assessment, the overall impact of CO2-led climate change to agricultural productivity will be mostly negative, as more and more crop varieties are exposed to temperature values outside their nominal range.
Objection V
This is an interesting claim, not merely because all available evidence contradicts it, but because its basic premise — that there is a necessary connection between relative concentration and effect — is fundamentally flawed. Were this the case, it becomes difficult to explain how substances like arsenic, plutonium, hydrogen sulfide, or even Vitamin C can, in sufficient quantities, wreak such havoc on our health. Exposure to H2S in concentrations above 50 ppm can lead to eye damage, while arsenic levels exceeding 10 parts per billion in drinking water are deemed unsafe by the WHO. What about carbon dioxide?
When we look at the contents of our atmosphere, we see that over 99% is tied up in molecular nitrogen (N2), molecular oxygen (O2) and argon (Ar). Everything else is a trace constituent. Carbon dioxide comprises a mere four-hundredths of 1% of total atmospheric composition. As a fraction, it is just 1/25th of 1%. As a decimal, it is currently 0.04%.

Composition of Earth’s atmosphere
But it is precisely the “everything else” that regulates the temperature of our planet. Unlike nitrogen and oxygen, which are almost entirely transparent to solar and terrestrial radiation and thus have no impact on temperature, greenhouse gases are transparent to solar but opaque to outbound radiation. This means that everything crammed into that tiny sliver above — CO2, water vapor (H2O), tropospheric ozone (O3), methane (CH4), nitrous oxide (N2O) and other infrared absorbers — is what gives our planet its “character,” its ability to retain heat. Without them, we would have no greenhouse effect, the mean temperature of the surface would be 20% lower, and Earth would be one solid block of ice from pole to pole.10
As we can see, it makes no sense to focus on relative concentration while ignoring the underlying properties of the molecule itself and its role in dictating the earth’s climate. While increases in any heat-trapping gas will bias the greenhouse effect toward warmer temperatures, CO2 is the most radiatively important because of its lifetime forcing potential and the feedback effects of water vapor. Pumping more CO2 into the air pushes temperatures upward, increasing the concentration of water vapor (since, per the Clausius–Clapeyron relation, warmer air can hold more moisture).11 By controlling the amount of water vapor — the most abundant GHG and the biggest contributor to greenhouse warming — CO2 controls the overall size of the greenhouse effect, effectively setting the temperature for the entire planet.12
Due to the proliferation of fossil fuels CO2 concentrations have skyrocketed in the last 150 years, a vanishingly brief epoch on the geologic time scale. Carbon dioxide’s imprint on the environment is observable and measurable and will continue in consigning us to carbon disequilibrium if left unchecked.
Objection VI
An important distinction to make here is that a local temperature increase does not mean a global temperature increase (and vice versa). We cannot look at specific regions in isolation and think that this tells us anything useful about global temperatures. It would be like picking a handful of stock prices and inferring a trend for the overall market.
During the so-called Medieval Warm Period (~950-1250 CE), warmth in some regions, namely those in the Northern Hemisphere, appears to have matched or exceeded (pdf) recent levels of warmth, while a global appraisal shows that the MWP was significantly cooler than recent global temperatures. From the IPCC Fourth Assessment Report:
“Regionally restricted evidence by itself, especially when the dating is imprecise, is of little practical relevance to the question of whether climate in medieval times was globally as warm or warmer than today.”
And from the Fifth Assessment Report:
“Thus current evidence does not support globally synchronous periods of anomalous cold or warmth over this timeframe, and the conventional terms of Little Ice Age and Medieval Warm Period appear to have limited utility in describing trends in hemispheric or global mean temperature changes in past centuries.”
The magnitude of the global temperature difference in question is best understood by seeing. First look at the surface temperature anomaly for the MWP (relative to the 1961–1990 reference period) here, and then compare that to the STA for 1999-2008 (relative to the same reference period) here. Images sourced from this article.
It’s important to keep in mind that the extent of warming is not uniform across the globe, just as we should expect from our study of the earth’s ocean and wind currents. Trade winds, Hadley cells, Walker and thermohaline circulations all transport heat around the surface and ocean basins, preferencing some regions over others. This does not mean, however, that some regions are immune to global trends, only that localized trends may be less acute and will lag behind the global trend owing to various thermal circulation patterns built into the earth’s climate system.
Objection VII
This one is little different from the previous appeal. Cherry-picking particular regions or small sample periods is unhelpful if what we really want to look at are average global trends. Unseasonable summers and winters fall under the domain of weather, which concerns short-term variation, while climate describes long-term variation. You can think of climate as the personality and weather as the mood. Intermittent digressions from the broader trend — known as internal variability — are predictably normal, but over a statistically meaningful length of time underlying patterns stick out.
As for the claim that the climate community augured global cooling in the 1970s? That’s a myth, albeit one with long legs. The majority of peer-reviewed literature at the time predicted warming from CO2 forcing. Those that didn’t were based on scenarios in which human-produced aerosols, namely from sulfur dioxide (SO2) emissions, continued to rise following a spike after the Second World War. The particulate matter associated with fine aerosols leads to global dimming.13
Those projections were never borne out of course, as pollution control measures soon caught up to our scientific understanding of sulfate aerosols and their impacts on human, nonhuman, and environmental health. Clean Air Acts were passed in a number of countries including the UK (1956), the U.S. (1963), and New Zealand (1972). With regulation in place, the cooling effects of short-lived sulfate aerosols started to dissipate in the 70s and CO2 began to dominate the climate system once more.
The whole “global cooling” trope is one of those myths that’s reached a level of truthiness simply as a function of being endlessly repeated. It is well understood today that our aerosol binge in the mid-20th century temporarily masked greenhouse warming, which resumed once those sulfates were taken out of the air.
Unfavorable Effects
Included here is a brief snapshot of the multiplicity of ills a warming climate brings to bear on the planet:
- Ice sheets melt in response to rising temperatures. Melting glaciers cause sea level to rise and land to submerge due to erosion and the thawing of permafrost in polar regions. Sea level rise of just 5 meters is enough to submerse major cities like New York, London, and Mumbai. For comparison, the Greenland ice sheet, together with its surrounding glaciers and small ice caps, contains more than 7 meters (23 ft) of sea level rise, while the Antarctic ice sheet, melted in its entirety, would raise sea levels more than 61 meters (200 ft).
- Fueled in part by a hotter climate, we’ve seen a dramatic increase in storm intensity since the 1970s. Warm oceans are jet fuel for hurricanes, amplifying their intensity, and higher sea levels means hurricanes can penetrate further inland.
- A warmer atmosphere contains more water vapor, increasing precipitation levels of all storms and aggravating coastal flooding. Other links have been found between polar amplification and extreme weather events here and here.
- Human health is threatened by reduced access to natural resources and water supplies, which can result in malnutrition and other health detriments.
- An increase in atmospheric CO2 is directly linked to increasing acidity of the oceans. This poses a serious extinction threat to major classes of marine organisms, including corals and bivalves, which will have ripple effects all their own.
- Increasing temperatures affect plant life by disrupting food chains and reducing botanical biodiversity.
- As with plants, hotter climates impact the animal kingdom in the form of sabotaged food chains, extinction of keystone species, and the erosion of genetic diversity. For example, longer summers and fast-receding sea ice impact polar bear populations as they depend on intact sea ice for their primary food source — seals. Environmentally induced migration puts bird species at risk of extinction; see here and here.
- Seasonal disruptions: Earlier spring and later frost means continually higher pollen counts for more of the year, increasing allergic reactions among humans especially.
- Condensed winters means fewer insects die, resulting in more to contend with in the warmer seasons.
- Higher CO2 concentrations mean more potent poison ivy.
There are also a number of feedback loops operative in a warming planet. When sea ice melts, the earth becomes darker as a result of the lower reflectivity of sea water relative to sea ice. Otherwise known as the ice-albedo feedback, this causes more sunlight to be absorbed, warming the oceans at an ever faster rate. Warmer oceans then melt more sea ice, reducing planetary albedo even further. More catastrophic is that warmer oceans melt ice shelves from underneath (called basal melt), and the thawing of ice shelves affects the flow of adjacent, non-floating ice (i.e., ice sheets and glaciers), thereby contributing to sea level rise. Warmer oceans also emit more CO2, causing more warming and increasingly active weather. The link in the chain that demands to be severed is human carbonization.

To the Holocene and Beyond
With more than 7 billion people on this planet, and 83% of its land area now under direct human influence, it’s hardly surprising we’re having a marked impact. Our collective footprint is manifest in the form of global warming. The evidence on hand couldn’t be less opaque: our escalating attachment to fossil fuels and greenhouse emissions has disrupted the earth’s energy budget, provoking feedback effects all across the planet. The climate research community has delivered this message unambiguously for more than five decades now, emphasizing in turn that if we fail to act timely and sufficiently, chances are superlative that the repercussions will be enormous — to our way of life and to those with whom we share a natural habitat.
Every living organism and ecosystem are influenced in some tangible way by the perturbations we’ve enacted. As custodians of this vibrant planet and the most observant of species, do we not have a moral obligation to shade our treasured kin from the consequences of our actions? If we are sensitive to the realities of climate science, humanity may one day worthily bear the title of Life’s Protectress. But there is much to do. We must move past the emotionally charged and politically fabricated “debate” and work together to hammer out feasible solutions for arresting climate change and tempering its ill effects. These burdens must not be left to future generations.
“I think we understand the mechanisms of CO2 and climate better than we do of what causes lung cancer. In fact, it is fair to say that global warming may be the most carefully and fully studied scientific topic in human history.”
–Ralph Cicerone, President of the National Academy of Sciences
—This post is also available for download at my research page.
—For newcomers, The Royal Society in the UK has prepared a concise primer here, along with another high-level FAQ in collaboration with the National Academy of Sciences here, while the EPA has their own digestible synopsis here.
—For comprehensive breakdowns of every conceivable argument against climate change, the Skeptical Science website is the go-to resource. Their superb history of climate science is a good place to start.
Further reading:
- The Rough Guide to Climate Change, 3rd edition (2011)
- Storms of My Grandchildren: The Truth About the Climate Catastrophe and Our Last Chance to Save Humanity (2010)
- The Hockey Stick and the Climate Wars: Dispatches from the Front Lines (2012)
- Funny Weather: Everything You Didn’t Want to Know About Climate Change But Probably Should Find Out (2006)
- Merchants of Doubt: How a Handful of Scientists Obscured the Truth on Issues from Tobacco Smoke to Global Warming (2010)
- Air Force and Navy pilots noticed first-hand this relationship between atmospheric CO2 and infrared energy in the 1950s when they found that high CO2 concentrations obstructed certain heat signatures on their radar systems. When using on-board heat sensors designed to pick up wavelengths in which CO2 is active, the visibility of signatures was severely compromised due to CO2 absorption. The Air Force still use these spectroscopic databases derived from calculations for heat-seeking missiles today, and it’s but one in a long line of validations of what Tyndall discovered so long ago. You can find a collection of Tyndall’s original research here.
[↩]
- From his 1906 work Världarnas utveckling (Worlds in the Making):
“Any doubling in the percentage of carbon dioxide in the air would raise the temperature of the earth’s surface by 4 degrees; and if the carbon dioxide were increased fourfold, the temperature would rise by 8 degrees.”
[↩]
- Milankovitch or orbital cycles refer to the orientation of the earth relative to the sun. There is strong correlational evidence that ice ages, and the glacial (colder) and interglacial (warmer) transitions that occur within ice ages, are caused by these cycles. Three main types of orbital variations impact climate: eccentricity (ellipticity), obliquity (axial tilt), and precession, each of which has characteristic periodicities. Eccentricity varies on an approximately 100,000 year cycle, obliquity on a 41,000 year cycle, and precession over a 26,000 year cycle. Currently, the earth is closest to the sun (perihelion) just about at the peak of southern hemisphere summer, northern hemisphere winter.
[↩]
- While the sun may be the most seductive culprit for this latest iteration of warming, there are three primary reasons we can rule it out. The first is that we haven’t seen an overall increase in the energy emitted by the sun in 35 years, while global temperatures have continued to rise. If the sun were in the driver seat, the earth should be either cooling or maintaining a steady temperature, but it should not be warming.
Second, solar forcing is unable to account for the observed thermal profile throughout the atmospheric column. An increase of sunlight at the top of the atmosphere would cause all layers of the atmosphere to warm, from the outermost exosphere to the innermost troposphere. But we observe warming in the troposphere and cooling in the stratosphere, an observation that can only be explained by an influx of GHGs released at the surface. The parallel pattern of tropospheric warming and stratospheric cooling was predicted way back in 1967. This is known as the vertical human fingerprint and now has solid observational support, per studies here, here and here.
Third, our measurements show that temperatures are increasing during both day and night, which is consistent with greenhouse forcing and inconsistent with solar forcing. If the sun were responsible, we would expect pronounced warming at the equator and more warming during the daytime than the nighttime. We do not observe this.
[↩]
- Berkeley Earth publishes two datasets: a land-only record extrapolated back to 1750, and a land + sea surface record going back to 1850 using modified HadSST data for the sea surface record. Comprising 1.6 billion temperature records from 39,390 different weather stations across the globe, the Berkeley Earth project is by a great margin one of the best datasets ever assembled for a climate study. All of the data is freely available online.
[↩]
- In fact, humans emit as much CO2 as 3,500 Mount St. Helens explosions annually. All told, human contributions to the global carbon cycle are more than 100 times those from all the volcanoes in the world — combined. Per Gerlach 2011: “On average, humanity’s ceaseless emissions release an amount of CO2 comparable to the 0.01 gigaton of the 1980 Mount St. Helens paroxysm every 2.5 hours and the 0.05 gigaton of the 1991 Mount Pinatubo paroxysm every 12.5 hours. Every 2.7 days, they emit an amount comparable to the 0.26-gigaton preferred estimate for annual global volcanic CO2 emissions.”
[↩]
- The rate of exchange is regulated by what is known as the solubility pump: as the temperature of seawater falls, more CO2 is dissolved in the oceans, and as the water warms its CO2 reserves are vented to the atmosphere.
A secondary and less quantified mechanism of oceanic CO2 uptake is the biological pump, the counterpart of the physico-chemical solubility pump. Organisms like phytoplankton which reside along the surface of seawater fix CO2 as a source of energy, removing it from the atmosphere. Long-term ecological impacts of climate change on planktonic growth are still being explored, but were they to threaten the survival of certain marine biota, atmospheric warming could be aggravated due to the loss of this biological sink.
[↩]
- Whether the oceans have a critical capacity for CO2 intake is a pressing topic in climate research. There is currently over 50 times more CO2 in the oceans than in the atmosphere, and paleoclimate records indicate that a tipping point could soon be reached in which the oceans become fully saturated (Cox et al. 2000 propose 5 GtC per year) and begin outgassing its excess CO2 back into the atmosphere, exacerbating the warming above.
[↩]
- I track to-date emissions in a file titled Global CO2 Emissions From Fossil Fuels, which you can download from my research page. Note that these figures include carbon emissions from gas (natural gas), liquid (oil) and solid (coal) fuel consumption, cement production and gas flaring, and do not include emissions from land-use changes (e.g., deforestation and logging, forest and peat fires, post-burn decay of remaining above-ground biomass, decomposition of organic carbon in drained peat soils). All data courtesy of the Global Carbon Project (GCP) and Carbon Dioxide Information Analysis Center (CDIAC).
[↩]
- This also goes to explain why Venus is hotter than Mercury despite being farther from the sun, and for that matter why the moon is so much colder than Earth. Early in its history, Venus lost its oceans to space, the primary reservoir of CO2 released by volcanoes pocking the surface. With the oceans boiled away, all of the stored CO2 was vented to the atmosphere, restricting the release of outbound heat. Not even Venus’ thick sulfuric clouds — which even today reflect large amounts of sunlight back to space — were enough to countervail the heating effects of CO2. The air composition on Venus now sits at 96% CO2, accompanied by an average surface temperature of 867° F (464° C), toasty enough to melt lead. And thus we have what is commonly referred to as the “runaway greenhouse effect.”
[↩]
- The relationship between atmospheric warmth and water vapor abundance has also been quantified: the atmosphere can hold 7% more water vapor for every 1 °C rise in air temperature (4% for every 1 °F). See here and here.
[↩]
- While CO2 is the major offender and a permanent fixture of any conversation about climate change, there are several other forcing agents that influence terrestrial temperatures. As noted, water vapor is massively important due to its amplification effects from non-condensing greenhouse gases. Other radiatively active gases, like methane and nitrous oxide, actually have higher global warming potential (GWP) than carbon dioxide when considered over shorter time scales. (GWP is a measure of a given gas’s efficiency at trapping radiation.)
For example, a given quantity of methane has 84 times the GWP of CO2 over a 20-year period and 28 times over a 100-year period. Considered over the same 100-year period, nitrous oxide has 298 times more impact per unit mass (GWP) than CO2. [Source] While both gases trap more heat relative to CO2 over these more compressed time frames, CO2 has much longer and more variable residence times thanks to its role in the carbon and other biogeochemical cycles.
About half of the CO2 released into the atmosphere is removed from the air on a time scale of 30-95 years as it’s mixed into the upper oceans and taken up by plants and other photoautotrophs during photosynthesis. This is the “fast” phase of the carbon cycle. However, around 20% of emitted CO2 lingers for many thousands of years for reasons related to equilibration between the deep oceans and atmosphere. It is these slower processes (including an even longer tail involving the geological reservoirs of the earth system) that make CO2 so potent. As David Archer explains, “different parts of the ocean equilibrate with the atmosphere on different time scales, ranging from a year for the tropical surface ocean to a millennium for the deep sea.” So unlike the exponential decay of other GHGs, CO2 persists on much longer time scales as it loops through the earth’s natural processes. Ultimately what this means is that even if we were to cease CO2 emissions tomorrow, global concentrations would not return to pre-industrial levels for more than a thousand years.
Lastly, aerosols and clouds are also important components of the climate system, with both direct and indirect effects on climate. Unlike greenhouse gases, which are positive forcing agents, these are generally negative forcing agents as they remove heat from the climate equation. One notable exception is black carbon or soot. Black carbon particles are a byproduct of incomplete fossil fuel combustion that contribute to global warming by reducing albedo (the ability to reflect sunlight) when deposited on snow and ice. Some scientists now believe it to be the second biggest contributor to global warming behind CO2.
[↩]
- Global dimming refers to the reduction of solar radiation received at the surface. Sulfate particulates and other aerosols clogging the upper atmosphere reflect solar energy back into space, preventing it from ever reaching the planet surface. Thus, SO2 acts as a negative forcing agent as it removes heat from the climate system, in contrast to CO2 which acts as a positive forcing agent.
[↩]

Comments