The Case of the Missing ‘Hot Spot’

One of the more exotic issues that seems to fade in and out of climate reporting is that of the missing “hot spot” in the tropics. A few less scrupulous onlookers have even used it as a prop in an effort to undermine the very foundation of human-caused global warming and the greenhouse effect right along with it. As we will see, even if the discrepancy is real (and unrelated to measurement uncertainty), it says next to nothing about greenhouse warming in general and the anthropogenic link in particular.
Before diving into the specifics of the hot spot, a brief word is in order about uncertainty. In climate science, uncertainty can be assigned either to the observational data or to the models, the latter of which are based on our best understanding of climate physics. Models aim to match observations, but you can have uncertainty on both ends. And the level of uncertainty depends on the specific variable under consideration.
For example, cloud effects and ocean variability represent key uncertainties in our climate models, while tropospheric temperature in the tropics is an area of uncertainty in our observations. When a mismatch arises, we should be cautious in assigning blame prematurely. The error may lie with the physics encoded in the models, but we also need to look to the observational side of the equation as a possible source of inaccuracy.
The Tropical Lapse Rate Discrepancy
The graphic below illustrates a well-known relationship between temperature and altitude. In the lower atmosphere — or troposphere — the air generally cools as you move away from the planet’s surface, until you get above the tropopause and into the stratosphere, at which point the relationship reverses. The rate of cooling in the lower atmosphere is known as the (positive) lapse rate. One atmospheric constituent that regulates the lapse rate is water vapor. Its role as a greenhouse gas allows the water molecules to absorb heat in the infrared released at the surface. It follows that regions with more moisture in the air should have a reduced lapse rate relative to regions with less moisture.
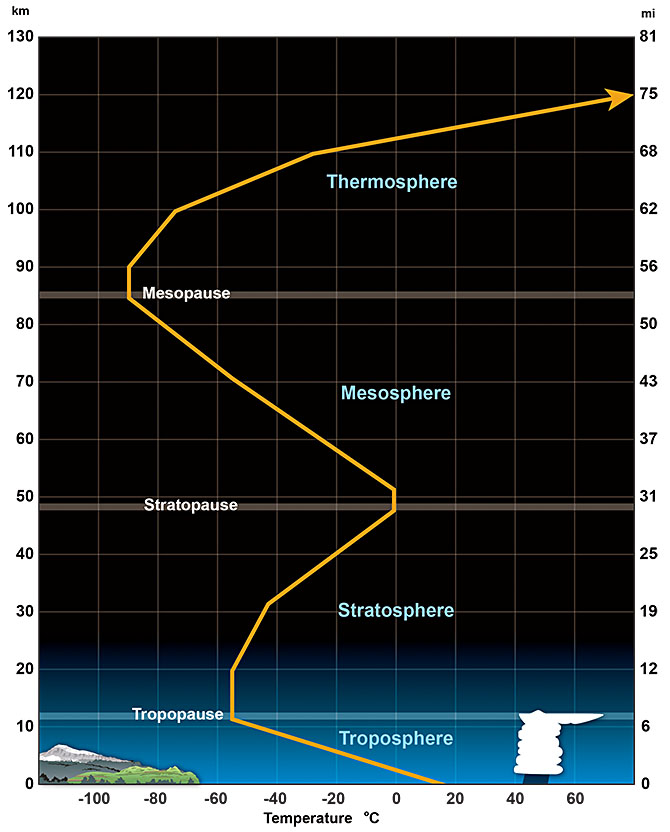
Tropospheric and stratospheric temperature are examples of positive and negative lapse rates, respectively.
This is where the infamous “hot spot”, otherwise called the tropical lapse rate discrepancy, comes in. Fundamental physics tells us that a warming planet should not only bring higher surface and air temperatures, but a concomitant increase in water vapor (because warmer air holds more moisture). The tropics have a unique physical profile compared with the polar regions and other extratropical latitudes in that you have more evaporation and more moisture. In NASA’s time series video below, you can see the band of water vapor that concentrates tightly around the equator, with some seasonal variation.
We should thus expect a lower rate of cooling above the tropics: due to its surplus of moisture, the air there should show pronounced warming in response to a warming trend at the surface. This expectation of amplified warming in the tropics is what has come to be known as the “hot spot” in climate science. Gavin Schmidt of NASA puts it this way:
Steve Sherwood of University of New South Wales echoes this physical relationship built into our climate models:
As we can see, the predicted phenomenon in the tropics is not linked exclusively to the release of fossil fuels. The high evaporative activity in the upper-air tropics serves as an accelerant for the generation of water vapor, amplifying the warming there — and adjusting the lapse rate downward — following any influx of heat at the surface. This additional heat can come from increased solar radiation, a reduction in aerosols, El Niño, etc. So a fall in the lapse rate, and thus the equatorial hot spot, was never considered a uniquely greenhouse signature to begin with. As Gavin Schmidt emphasizes: “It bears stating again that the expected amplification has nothing to do with the greenhouse effect – it is just a function of the surface warming.”
Resolving Observational Uncertainty
So the question now is whether this hot spot built into all of our climate models is reflected in the observational record. The answer, at least initially, was not exactly, the reason being that the observational record is not exactly perfect. Climate science veterans will be familiar with the many headaches involved with reconciling the atmospheric trend data with surface trend data.
Early on we had a more glaring discrepancy in that the tropospheric data were showing a cooling trend, not just at the tropics but at all latitudes. Thanks to greater collaboration among the scientists working with the data, the spurious cooling trends were chalked up to a combination of satellite drift, daytime heating and a failure to properly account for these factors when compiling data from the various sensor and hardware redesigns. Necessary adjustments were made to the processing, and the variance is now isolated to the rate of tropospheric warming and trends in the tropics.
Unbeknownst to researchers in the mid-to-late 20th century, capturing temperature trends in the troposphere is a trickier undertaking compared with collecting in situ measurements at the surface. Atmospheric temperature data is derived from two different sources: radiosondes — measuring devices carried high into the air by weather balloons — and satellite-based instruments, with the former record beginning in 1959 and the latter in 1978.
Like any device used for climate study, both are susceptible to bias, and to a much greater extent than their land-based counterparts. Unlike thermometer readings taken on the ground, upper-air instruments do not measure temperature directly. Instead, temperature is backed into by sampling the radiance of Earth at infrared and microwave wavelengths, which is then run through an inversion algorithm. Along with the fact that algorithms vary, instruments aloft must contend with a slew of other uncontrolled effects that complicate accurate sampling. Some of these have already been mentioned, such as satellite drift from orbital decay and solar heating in daylight. Measurement uncertainty can also arise when ice from rain clouds gloms onto the temperature sensor, from poor spatial sampling of the radiosonde network in the tropics, and from cross-calibration among different equipment.
Consequently, even instruments of the same “breed” tend to differ in their readings. For example, the two leading datasets for upper-air temperatures — UAH and RSS — produce incongruous trend data, with neither dataset correlating completely with surface trends. This isn’t too surprising once we consider how much this equipment has changed over the years. The satellite-based instruments have gone through multiple iterations, each of which introduces new biases and peculiarities. (RSS alone has gone through 9 different iterations of their microwave sounding units (MSUs) and at least 8 versions of their AMSUs.) All of these data must ultimately be merged in order to derive trend data. Failing to correctly intercalibrate (or homogenize) the composite of outputs will result in a messy apples-to-oranges scenario and render the data unusable. As one can imagine, removing all of these systematic biases can be a logistical nightmare.
Such difficulties are nothing new. And considerable time and effort have been spent working out how to correct for them. While significant uncertainty still surrounds the satellite record, the fact that the two separate datasets are in disagreement with each other suggests instrument error is to blame and not faulty physics or surface measurements. A second indicator that the discrepancy is at least in part attributable to instrumental bias is that we see the same trend in both the troposphere and stratosphere, the opposite of what we should expect, as Gavin Schmidt notes here:
What about the hot spot? After all, even if the upper-air data are inconsistent with the surface data, we should still see evidence of a diminishing lapse rate in whatever data we have. Looking at seasonal and annual time scales, both radiosonde and satellite-based networks show the hot spot. Yet when we zoom out for the longer, multidecadal trends, we have seen some deviation from the models and physics-based expectations. Given the aforementioned heterogeneity of these networks since inception, this result is hardly enough to send climate scientists back to the drawing board. In fact, these less than ideal approximations help explain why theoretical expectations only diverge where the observational data is least reliable.
While we can’t go back in time and reconfigure all of the hardware for smoother comparison, science doesn’t stand still, and more recent reanalyses have brought the observational record into better alignment with global climate models. Notably, Sherwood et al’s May 2015 study has resolved the bias in the radiosonde trend data and confirmed the hot spot using a mix of Kriging and linear regression techniques. This study confirms that the troposphere is warming as expected and is in line with model predictions.
For reference purposes, I will provide a list of the key studies in chronological order below:
—Contribution of stratospheric cooling to satellite-inferred tropospheric temperature trends (Fu, et al. 2004):
—Satellite-derived vertical dependence of tropical tropospheric temperature trends (Fu, Johansen, 2005):
—Radiosonde Daytime Biases and Late-20th Century Warming (Sherwood, et al. 2005):
—The Effect of Diurnal Correction on Satellite-Derived Lower Tropospheric Temperature (Mears, Wentz, 2005):
—Amplification of Surface Temperature Trends and Variability in the Tropical Atmosphere (Santer, et al. 2005):
—Biases in Stratospheric and Tropospheric Temperature Trends Derived from Historical Radiosonde Data (Randel, Wu, 2006):
—The Answer is Blowing in the Wind (Thorne, 2008); paper: Warming maximum in the tropical upper troposphere deduced from thermal winds (Allen, Sherwood, 2008):
—Toward Elimination of the Warm Bias in Historic Radiosonde Temperature Records—Some New Results from a Comprehensive Intercomparison of Upper-Air Data (Haimberger, et al. 2008):
—Robust Tropospheric Warming Revealed by Iteratively Homogenized Radiosonde Data (Sherwood, et al. 2008):
—Consistency of modelled and observed temperature trends in the tropical troposphere (Santer, et al. 2008):
—Critically Reassessing Tropospheric Temperature Trends from Radiosondes Using Realistic Validation Experiments (Titchner, et al. 2009):
—Atmospheric temperature change detection with GPS radio occultation 1995 to 2008 (Steiner, et al. 2009):
—Changes in the sea surface temperature threshold for tropical convection (Johnson, Xie, 2010):
—Tropospheric Temperature Trends: History of an Ongoing Controversy (Thorne, et al. 2010):
—Revisiting the controversial issue of tropical tropospheric temperature trends (Mitchell, et al. 2013):
—Atmospheric changes through 2012 as shown by iteratively homogenized radiosonde temperature and wind data (Sherwood, Nishant, 2015):
Conclusion
From the above we can see that the hot spot imbroglio is yet another example of excitable contrarians missing the forest for the trees. Since the models are physics-based (and very well-established physics at that), it is overwhelmingly more likely that the physics is right and the measurements are not. Efforts to properly aggregate the discontinuous data sets have affirmed this basic picture. And contrary to claims by partisan media, a missing hot spot would not seal the fate on anthropogenic warming.
In terms of the human fingerprint, there are several discernible signals, including the parallel effect of tropospheric warming and stratospheric cooling, the escalating C-12 ratio in the atmosphere, a rising tropopause, reduced atmospheric oxygen levels, ocean acidification, and the to-date release of fossil carbon, all of which powerfully confirm that we are moving massive amounts of carbon from the “slow” domain into the “fast” domain, kicking the planet’s natural systems into overdrive.
Further reading:
—Tropical tropospheric temperature, instrumental and proxy trends via The Way Things Break
—My lay-friendly primer on the science of global warming: A Climate of Change, also available for download at my research page, in addition to the above post.)

Comments